We have previously discussed the importance of fuel management for the profitability of operations. It has become clear that several factors play a significant role in fuel consumption in the mining industry.
These factors include the speed of transport, the way operators use the equipment, the quality of the roads and access ramps, the load transported and its average, the distances traveled (which can be visualized in a comparative graph) and the practice of idling, among other relevant considerations.
These interconnected elements form a complex picture that can be optimized to increase efficiency and reduce fuel consumption in your operation. And that’s exactly what we’re going to talk about today.
If you’re interested in this subject, keep reading!

HOW TO REDUCE FUEL CONSUMPTION IN TRANSPORTATION EQUIPMENT?
1.1 – Analyze the absolute monthly consumption of transport equipment.
The graph below is a useful tool for analyzing the fuel consumption of transport equipment. It shows the amount of fuel consumed per hour of operation.
With it, we can analyze the average fuel consumption, either by time or distance traveled.
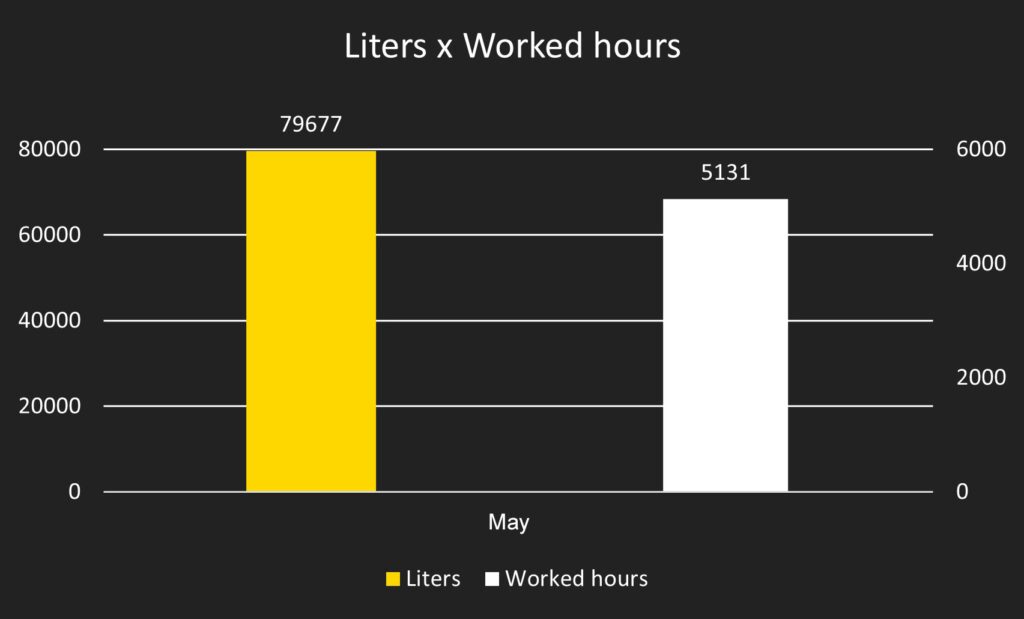
Based on this information, you can identify possible areas for improvement in equipment performance or operator efficiency.
For example, very high fuel consumption indicates that the equipment is not operating under optimum conditions. In this case, factors such as overloading, idling or inadequate maintenance should be investigated.
On the other hand, very low consumption would indicate that the equipment is not being underutilized, operating at excessively low loads, for example.
1.2 – Observe the specific consumption of each equipment.
Unlike the graph mentioned above, which is useful for analyzing fuel consumption, the Miles/L graph is extremely important for analyzing how efficiently the fuel is being used.
Efficiency is calculated by dividing the distance traveled by the amount of fuel consumed, so the Miles/L graph complements the L/H graph.
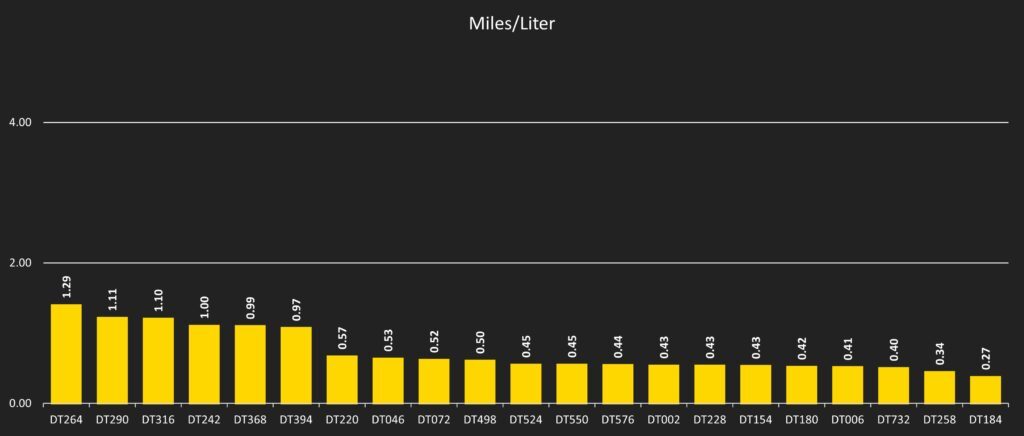
You can use the Miles/L graph to compare the efficiency of different pieces of equipment, as well as their efficiency over time. This can identify, for example, operator trends and opportunities for improvement.
In addition, it allows you to compare the efficiency of different fleets and transport equipment, and the indicator provides a view of the impact on operating costs in relation to the transport distances performed.
2.1 – Analyze the average monthly speed of your transport operation and rank the average speed of operators.
The monthly average speed graph is a useful tool for evaluating equipment performance and operator efficiency.
Diesel consumption, for example, is a key concern due to the high cost of fuel and its environmental impact; vehicles operating at high speed can consume more fuel due to aerodynamic resistance and increased inertia.
In many diesel engines, fuel efficiency is optimized in a certain speed range; operating below this can lead to lower fuel efficiency and, consequently, higher diesel consumption.
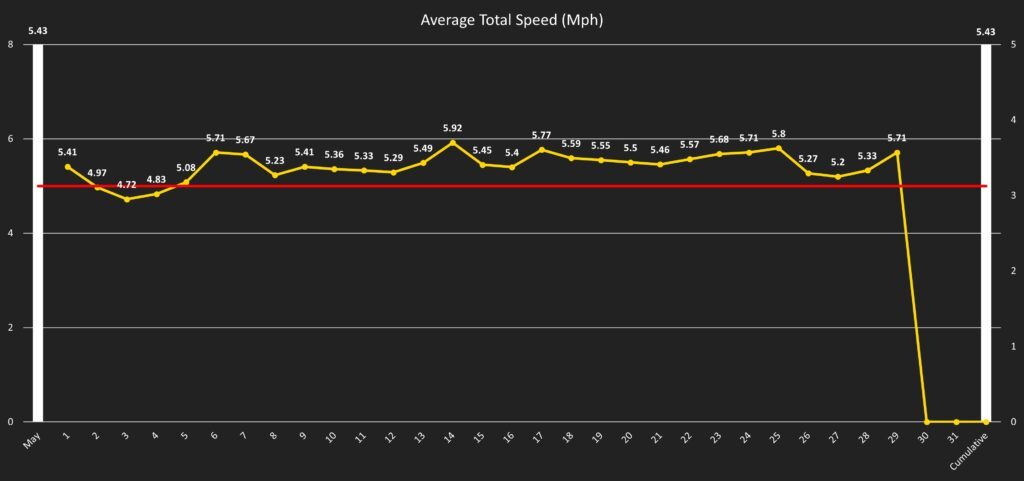
It is also possible to understand, in more detail, which operators have shown inefficiency in the operation according to the average speed obtained each month. As we can see in the graph below and/or assess which operators have the ideal operational profile.
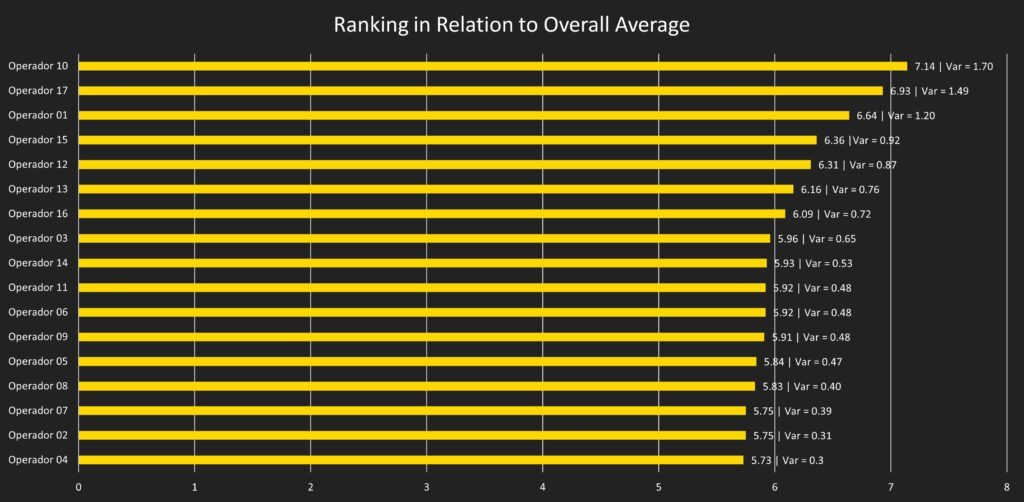
Tip: Carry out driving training with operators whose average speed is below the stipulated speed.
2.2 – Analyze the Average Haul Distance.
With the monthly Average Haul Distance graph, you can evaluate factors related to the performance of your operation.
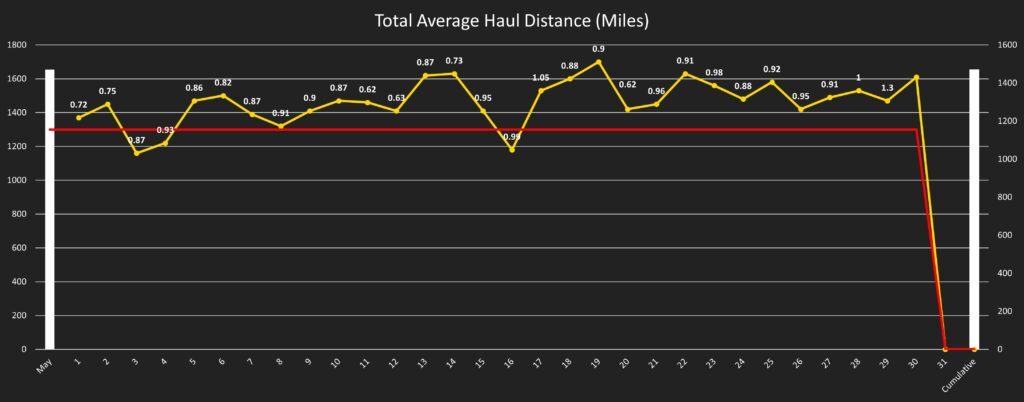
If you see a trend of increasing Average Haul Distance, this indicates that your operation is becoming increasingly efficient. On the other hand, when Average Haul Distance behavior is decreasing, it is linked to inefficiency. In relation to fuel, the lower the fuel consumption, the higher the Average Haul Distance, because Average Haul Distance is divided by energy consumption.
With a lower Average Haul Distance, it is possible to seek the alternative of using more efficient equipment, according to research carried out by the University of Cambridge in 2023, which found that more efficient mining equipment can increase Average Haul Distance by up to 50%.
3 – Load Used/Average Load.
The graph below shows that the mining operation moves 663,000 tons of material per 200,000 liters of fuel (approximately). This means that the operation is consuming around 0.3 liters/ton of material moved.
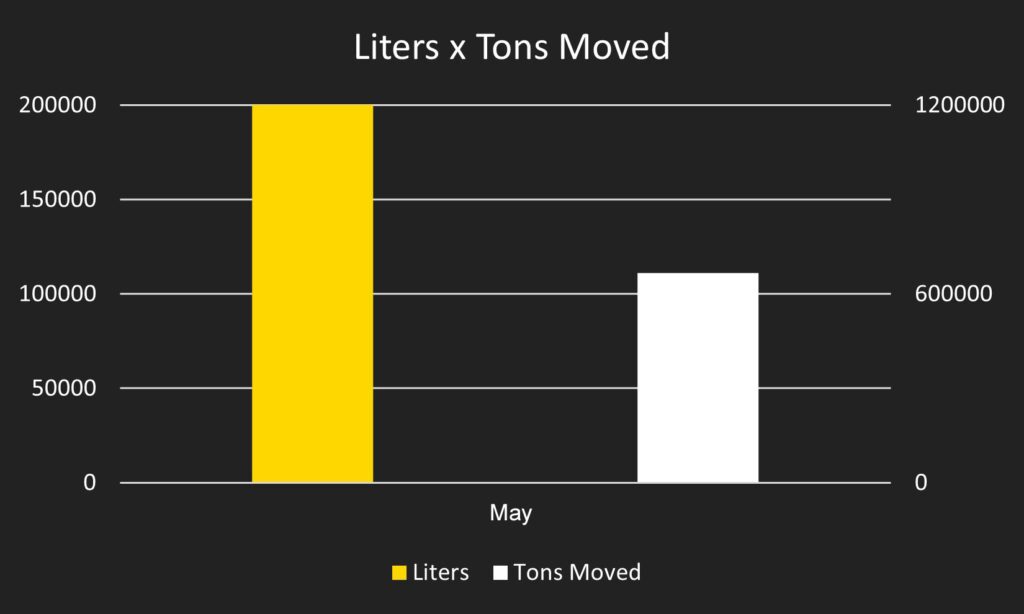
This figure is above the ideal value, which would be 0.2 liters/ton. In this way, we can look for the causes before looking for an efficiency measure to improve investments and so on.
Some of the causes to investigate would be: inefficient equipment, average load, adverse weather conditions in the month and topography of the terrain. The latter is a topic we’ll cover below, along with idling.
4.1 – Using telemetry to assess ramps and accesses.
Below is the Telemetry according to the average speed of the equipment in the operation. The quality of the ramps and accesses in an operation can significantly affect the average speeds of the equipment. With this tool, we can see which areas are indicating lower speeds and understand why.
Poorly designed or constructed ramps and accesses can increase the effort required to move the equipment, factors such as bearing, torque and others are included.
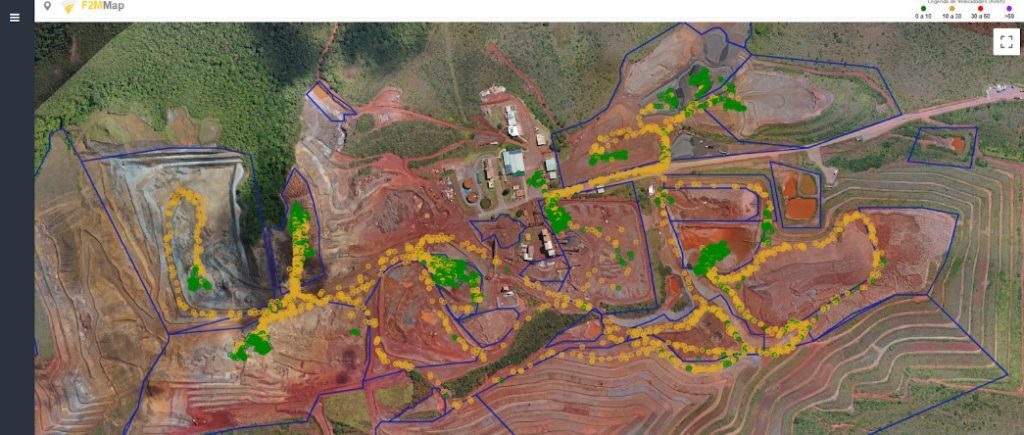
Tip: Evaluate track conditions and correct any problems that are interfering with speed.
Telemetry can be used to monitor average speeds and idling operation, and can be the basis for identifying opportunities for improvement, such as designing and building safer and more efficient ramps, making the operator feel more comfortable using more continuous and consequently higher speeds.
4.2 – Using telemetry to understand why equipment idles.
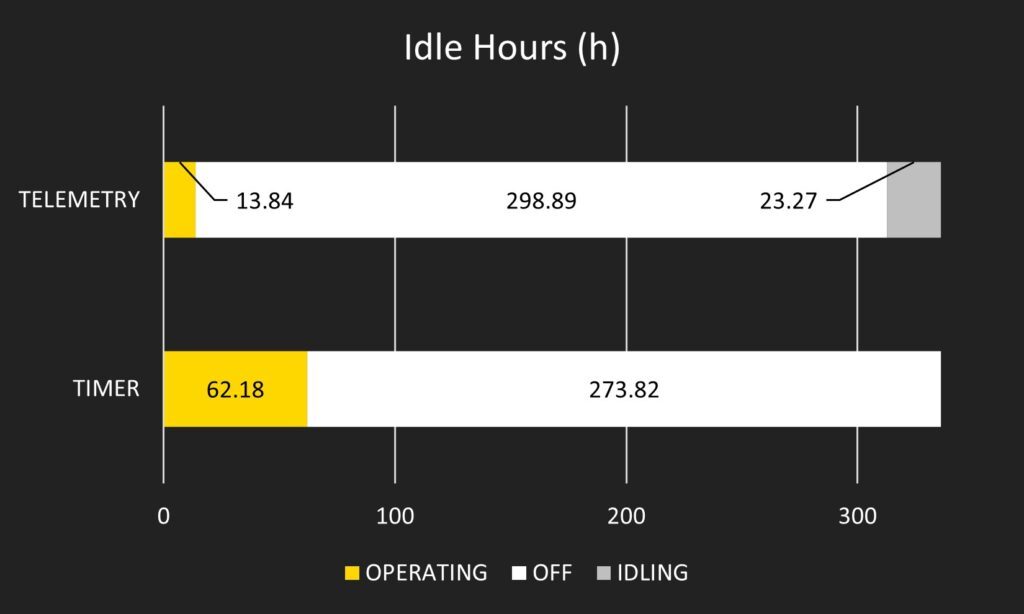
Idling is also included and can be observed via Telemetry. Equipment that idles for long periods of time can consume a significant amount of fuel without generating results in an unproductive way. This indicator can be associated, for example, with the quality of ramps and access, as well as idling while waiting for loading and/or maintenance.
Take a closer look at maintenance in order to avoid and correct any potential problems with equipment that indicates lower speeds than others. We can also look at the FAST2 Mine report on idling hours. An example below:
In the case of equipment that is not being used, it is important to instruct the team to turn off the equipment to reduce fuel consumption and, consequently, with improvements, the waiting time for loading would be shorter. In this way, in areas with a higher idling rate because loading is taking so long, it could be considered reassigning some equipment to fronts that have fewer idling problems.
4.3 – RPM
We can also talk about the rpm data that FAST2 Mine’s Telemetry provides.
When combined with average speed, this makes it an indispensable tool for optimizing fuel consumption in operation. This makes it possible to monitor engine behavior in real time and adjust operating practices to achieve better fuel efficiency.
HOW CAN FAST2 MINE HELP REDUCE FUEL CONSUMPTION IN YOUR OPERATION?
With the FAST2 Mine modules, you can use Mining Control to optimize routes and reduce waiting times, thus reducing travel time and, consequently, fuel consumption.
Grade Control, a module available in Mining Control, will ensure that ramps and accesses are designed and executed in accordance with best practices, reducing the effort that the equipment will have on a daily basis.
Telemetry is also a tool you can use with FAST2 Mine. With it you can monitor and analyze fuel consumption in real time, helping you to more effectively identify equipment or machines that are consuming more fuel than normal.
Did you like this content? Share it on your social networks!