Today’s Knowledge Journey into Operational Indicators: Let’s Talk about handling! In the previous article, we introduced the context of operational indicators focusing on the concept of hours. We discussed the fundamental principles for mine operations. If you haven’t checked it out yet, we strongly recommend following the link to avoid missing any crucial information.
Today, we’ll delve into a few more concepts about handling. And in the next post, get ready for an exciting case study that will apply all the equations we’ll present in this blog! So, let’s get to it? Put on your miner’s helmet and let’s develop this fascinating topic in depth!

HANDLING:
Successful mine handling starts at the planning stage, with correct fleet sizing, target forecasting and a good relationship between the loading and transport machines (matching). But these are just some of the many elements that need to be considered.
In addition, the pursuit of productivity must be seen as a crucial factor, acting as an indispensable ally in determining various parameters that we will explore shortly. A meticulous and strategic approach from the outset ensures more efficient and profitable operations, optimizing the use of available assets and maximizing the results of your mine’s operation.
TRANSPORTATION CYCLE TIMES:
Transport cycle times cover each stage of the actual truck cycle, such as empty transit, full transit, loading time, tipping time, maneuvering time when loading, maneuvering time when tipping, queuing time when loading and queuing time when tipping.
LOADING TIME:
Loading time (LT) refers to the average time needed for the loading machine to load the trucks, be it ore on trucks, wagons or other modes of transport. Be aware, however, that this process can be hampered by various problems such as:
- Incorrect positioning between the truck and the loading equipment;
- Inadequate matching between truck and excavator (the ideal is between 3 and 6 passes);
- Material leaking from the excavator shell;
- Inadequate granulometry due to blasting with excessive quantities of blocks;
- Inadequate bench or pile height for the size of the loading equipment;
- Loading bays in poor operating conditions (drainage, lining, space, etc);
- Loading bays with inadequate gradients or poor rolling conditions;
- Lack of operator training and supervision.
WHAT CAN POORLY PLANNED MATCHING CAUSE?
Inadequate planning in the matching process can lead to a series of operational problems that directly impact the efficiency and profitability of transportation operations, such as:
- Average transport load losses;
- Long loading times;
- Loading queues (convoy effect);
- Increased truck maintenance;
- Poor square conditions (material leakage).
TIPPING TIME:
Tipping time (TC) refers to the time required to tip, i.e. to unload the contents of a tipper truck or other similar vehicle at its tipping point, which can be a buffer pile, intermediate pile or crusher. Problems that can occur in this process include:
- Incorrect positioning of the truck;
- -Medium load out or poorly distributed;
- Operator insecurity at landfill tips;
- Moisture in the material;
- Mechanical problems with driving and lifting the weighbridge;
- Lack of training and monitoring of operators.
LOADING AND TIPPING QUEUES:
This topic refers to the waiting that occurs when there is a sequence of vehicles, such as dump trucks, waiting to be loaded or unloaded at a given location. In this case, possible causes include:
- An undersized fleet;
- High maneuvering times;
- Operational bottlenecks;
- Loading plazas in poor operating condition;
- Problems with dismantling material;
- Lack of queue management;
- Inadequate allocation of trucks by excavators.
CONVOY EFFECT: high queue times and high load idleness represent a sign of operational bottlenecks in the cycle, causing the CONVOY EFFECT, where sometimes there is a queue at the excavator and sometimes it is waiting for a truck.
FULL AND EMPTY MANEUVERING TIME:
“Full and empty maneuvering time” refers to the time required for a vehicle, such as a dump truck, to perform a complete maneuver, whether it is loaded (full) or empty. What are the possible causes of excessive maneuvering times?
- Incorrect positioning of the loading or transport equipment;
- Incorrect positioning of the mining advance or material layout;
- Loading and tipping stations in poor operating condition;
- Lack of pre-maneuvering or bilateral loading;
- Lack of training and monitoring of operators;
- Lack of communication between equipment and transport operators.
FULL AND EMPTY TRANSPORT DISTANCE:
The “full and empty transport distance” refers to the distance traveled by a vehicle, such as a dump truck, while it is either loaded (full) or empty. Want to know what the possible causes of high distances are? Check them out:
- Lack of mine access planning;
- Lack of a project for repositioning crushers or tipping points;
- Lack of synchronization between pushback accesses;
- Obstruction of main accesses;
- Equipment passing through the mine plan;
- Lack of operational planning for accesses.
AVERAGE HAUL DISTANCE:
The average haul distance is an important parameter for mine operations, referring to the average distance that materials or ores need to be transported from the point of extraction to the point of unloading or processing. This parameter directly influences efficiency, operating costs, fuel consumption and overall productivity.

TRANSPORTATION TIME:
The transport moment allows you to measure the performance of transport equipment for fleets of similar sizes, regulating the mass moved by the mileage traveled and hours worked. So pay attention: the higher the transport moment, the more productive the equipment or fleet has been.

TRANSPORTATION FLOW:
The transportation flow (TF) indicates the number of trucks that are expected to pass a certain place in the mine each hour. The formula used to calculate TF is:

In which,
PDT = Global Productivity;
Qnt. Truck = Truck Quantity;
AA = Asset Availability;
MU = Machine Utilization;
AL = Average Load.
AVERAGE LOAD (AL):
The average load corresponds to the average mass carried by a truck, which has a direct impact on the productivity of the equipment. The average load can be calculated using the parameters of the Load and Haul equipment.

In which,
B. Vol = Bucket Volume;
F. Fac = Fill Factor;
S. Dens. = Swell Density.

In which,
N.P = Number of passes;
B. Vol = Bucket Volume;
F. Fac = Fill Factor;
S. Dens. = Swell Density.
The average load can be calculated using the parameters of the Loading and Transportation equipment. Some factors that can influence the average load value:
- Lack of gauging and monitoring (random weighing);
- Lack of monitoring of the average weight value registered in the fleet management system;
- Density and swelling of materials;
- The condition of the truck’s weighbridge;
- Filling factor;
- Dead load on the weighbridge;
- Matching between loading and transportation equipment;
- Payload of the equipment manufacturer;
- Type of tire used;
- Physical condition of the equipment, low engine power;
- Among others.
SWELLING:
The swell factor correlates the specific mass in the natural state (in-situ) and the specific mass in the “loose”/fragmented condition for transportation. This factor is essential for calculating the apparent increase in volume that rocks show after fragmentation.

In which,
SF = Swelling factor;
SW(IN) = Specific weight of the material (in-situ);
SW(SWD) = Specific weight of the material (swelled);

In which,
Vs = Volume of rock material after fragmentation;
Vc = Original volume of material before cutting, i.e. in-situ;
SF = Swelling factor;

In which,
s = swelling
IDLENESS:
Idle time can be associated with the time the loading machine is waiting for the truck or the equipment’s loading interval. Possible causes:
- Poorly dimensioned fleet – Too many trucks or not enough loading equipment;
- High maneuvering time;
- Convoy effect;
- Loading plazas in poor operating condition;
- Problems with dismantling – High block cleaning times;
- Lack of queue management;
- Inadequate allocation of trucks by excavators.

In which,
T. Await. Truck = Time Awaiting Truck
Load T. = Load time
MILEAGE TRAVELED:
The mileage traveled makes it possible to compare the performance of transport equipment for a given period. This indicator takes into account Asset Availability (AA), Machine Utilization (MU), Fixed Times and Speed.

SPEED:
The average speed is the ratio between the displacement of the equipment and the time spent to perform this displacement. Some factors that impact the average speed are:
- Poorly conditioned or poorly designed tracks;
- Inclines with grades above the permitted limit;
- High levels of dust or fog;
- Poorly planned/executed drainage;
- Operational bottlenecks such as gates, narrow accesses, and sections with speed restrictions;
- Low engine power of trucks;
- Different sizes of trucks operating simultaneously;
- Lack of operator commitment;
- Lack of training, guidance, and supervision of operators;
- Unfavorable weather conditions.
Additionally, we have the Rimpull chart, an essential metric used to approximately calculate average speeds in relation to the rolling resistance factor, considering the slope of the track.
For a detailed explanation of this chart, be sure to check out our blog post! Visit the link and deepen your knowledge.
PRODUCTIVITY:
Each indicator that makes up the equipment cycle has a weight of influence in the productivity equation. It is necessary to be aware of each indicator and the reasons that impact them in order to improve equipment productivity.
FACTORS INFLUENCING TRANSPORTATION PRODUCTIVITY:
- Average load;
- Cycle time – loading, tipping, queuing, maneuvering…
- Transport distance;
- Transport speed.
In addition, we can use equations to portray operational efficiency in terms of the speed with which the tonnage of material is transported from its origin to its destination.
Using the following equations:
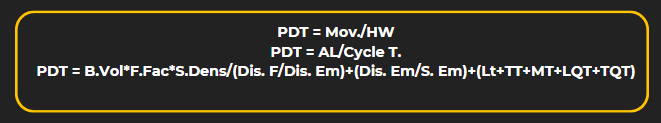
In which,
Mov. = Movement;
HW = Hours worked;
AL = Average load;
Cycle T. = Cycle Time;
Dist. F = Distance full;
Dist. Em. = Distance empty;
S. Full = Speed Full;
S. Em = Speed Empty;
LT = Load time;
TT = Tipping time;
MT = Maneuvering time;
LQT = Loading queue time;
TQT = Tipping queue time;
B. Vol = Bucket volume;
F. Fac = Fill Factor;
S. Dens = Swell Density.
LOAD INFLUENCING FACTORS:
- Loaded load on the truck;
- Loading time;
- Idleness – time waiting for truck.
To analyze the Global Productivity of the Load (PDT), we can use the following equation:

In which,
Mov. = Movement;
HW = Hours worked;
AL = Average Load;
Cycle T. = Cycle Time;
LT = Load Time;
F. Fac = Fill Factor;
S. Dens = Swell Density;
Idle Time = Waiting time for transportation equipment.
Interesting, isn’t it? We hope that all the information so far has been valuable for the rapid growth of your operation.
That brings us to the end of our post on handling, which has been quite busy! Next time, we’ll bring you a practical example that uses all the equations and concepts we’ve presented so far. See you soon! Don’t forget to like and share!
READ MORE:
Operational indicators: concept of hoursHow to use the Rimpull Graph to estimate the speed of transportation equipment?