Previously, we looked at some definitions of the Rimpull Graph. In this article, we’ll move on from theory and into practice, demonstrating how to use the Rimpull Graph to estimate the speed of a particular piece of transport equipment on road segments.
Keep reading to find out more!

STARTING POINT:
Before we begin, it is important to know that a 10% slope is equivalent to a vertical rise of 1 meter for every 10 meters of horizontal advance. This is proven by the equation:
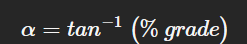
It is also worth pointing out that the Rimpull Graph is suitable for load-bearing equipment, such as trucks.
In addition, it is crucial to emphasize rolling resistance, which is the force needed to overcome inertia, because on good roads, we can estimate that the slope, using a frictionless truck on a slope as a reference, will be 2%.
HOW IT WORKS IN PRACTICE:
In this example, we’re trying to make things easier to understand:
- Segments AB and CD are to be assessed at an effective gradient of 2%.
- Segment BC (uphill) will be graded at an effective gradient of 10% + 2% = 12%.
- Segment CB (slope) will be graded at an effective gradient of 10% – 2% = 8%.
In our example we will use a transport truck with the following specifications:
- Equipment: CATERPILLAR 793C
- Tire: 40.00R57
- Estimated empty weight: 158.760 kg
- Maximum gross weight: 376.588 kg
With these specifications and the information given at the beginning about the evaluation of the segments, we can look at the graph and analyze the maximum speed we can have in each situation.
HOW TO ANALYZE THE RIMPULL GRAPH:
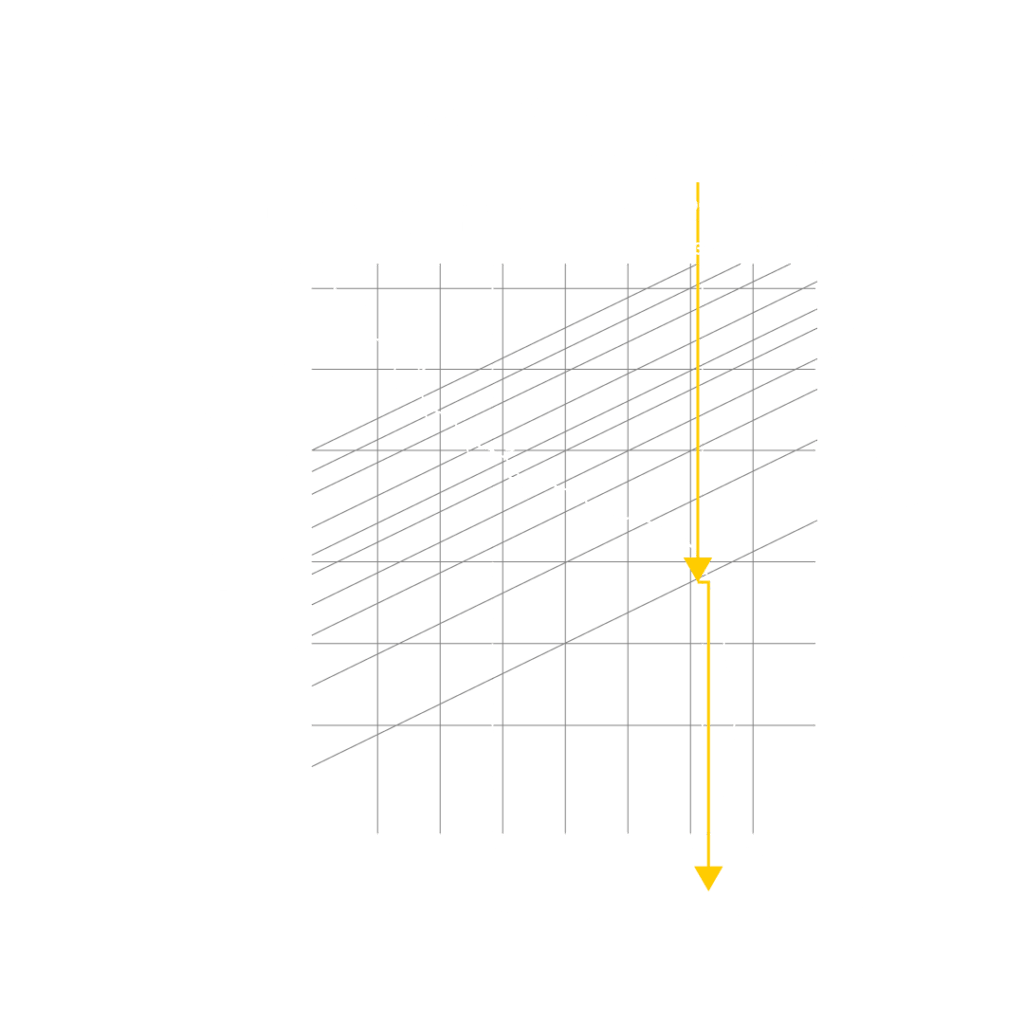
To observe the graph, we can follow the process as follows:
- 1) Draw a vertical line from the truck’s gross weight to the rolling resistance line;
- 2) From the previous point, draw a horizontal line to the rimpull curve. The point found represents the gear that should be used for the given conditions;
- 3) Then draw a vertical line until you meet the speed axis. The intersection point shows the estimated speed for the lane segment for the conditions shown.
For our first example, we will consider the data specified for the loaded truck:
With this, we can consider a speed of 52 km/h for the fleet given the conditions.
UPHILL TRUCKS:
However, if we are on a slope, where the truck will have to exert a much greater force to overcome the inertia, this graph can be very different, as shown below.
We obtained a speed of 10 km/h. This very low figure is due to the truck being loaded, plus the steepness of the road. This proves that a totally steep track is inferior to a route with flat stretches and interspersed slopes.
EMPTY TRUCKS:
Finally, we can analyze the behavior of the rimpull graph for an empty truck.
Even with an empty truck and 2% rolling resistance, we reached an approximate speed of 54 km/h according to the rimpull graph.
For a further estimate, we can calculate the cycle time (CT):


CONCLUSION:
If your productivity is below target, it’s crucial to assess the condition of the roads and ramps, using the rimpull chart to analyze the expected performance. Identifying low-speed stretches in the mine that have a direct impact on fleet efficiency is essential.
FAST2 Mine offers the ideal solution through its Mining Control system, designed to optimize production and overcome operational challenges.
Discover our Mining Control system and get your production up to speed!